Lagging COVID-19
A tour through COVID-19 Admission data
During the interregnum in COVID-19 waves in the latter portion of 2020, there was much debate about just when we would need to see the return to mandatory lockdown. From calls for circuit breakers, to desperately trying to hammer home the nature of the phrase “exponential growth”, the general consensus agreed that by the time we started to see a significant shift in the numbers, a large part of the damage would already have been done.
One component of this was the effect of the delay between testing positive for COVID-19, and becoming unwell enough to require hospital admission, which typically was in the order of 7 – 10 days. It’s possible to imagine an infection that causes rapid illness, and so declares itself much sooner, in which the rates of new infections would be a closer representation of current healthcare burden. Cholera for example, only has an incubation period typically between 0.5 – 4.5 days1, and makes itself known with rampant “rice water” diarrhoea.
On the flip side of things, now that lateral flow tests are no longer freely available, people are more likely to test positive later in their disease. Such as when they rock up to hospital with a fever, cough, shortness of breath, and a mysterious lack of smell.
I should say that the importance in this lag phase has not been overlooked. There have been large analyses of COVID-19 case data2, and it has been incorporated into modelling efforts from the beginning of the pandemic3. However, in the name of reproducibility it is always nice to be able to demonstrate things oneself.
From December 2020 through to April 2021 I was working on the respiratory ward at University Hospital of Wales, AKA the big tertiary teaching hospital in Cardiff that somewhat resembles a cruise ship. In keeping with the nautical theme, this encompassed the period affectionately known as the second wave4. During this time, all non-invasive ventilation for COVID-19 in the area was consolidated on the ward I was working.

Non-invasive ventilation is an intermediate therapy, providing oxygen buffeted along with a pressure designed to give the lungs a helping hand. It’s typically only given after someone has failed on conventional oxygen, all the way up to 15 litres of the good stuff a minute, or as close to 100% oxygen as it’s practical to give on a regular ward. Suffice it to say that these people are sick, although not sick enough to go to the intensive care unit, or too sick to be considered a candidate, though that’s a different discussion.
During my time there, we collected data on the numbers of patients that were admitted, treated, discharged, and died. We can naively plot the daily admissions to the high respiratory care unit and see what that gives us.
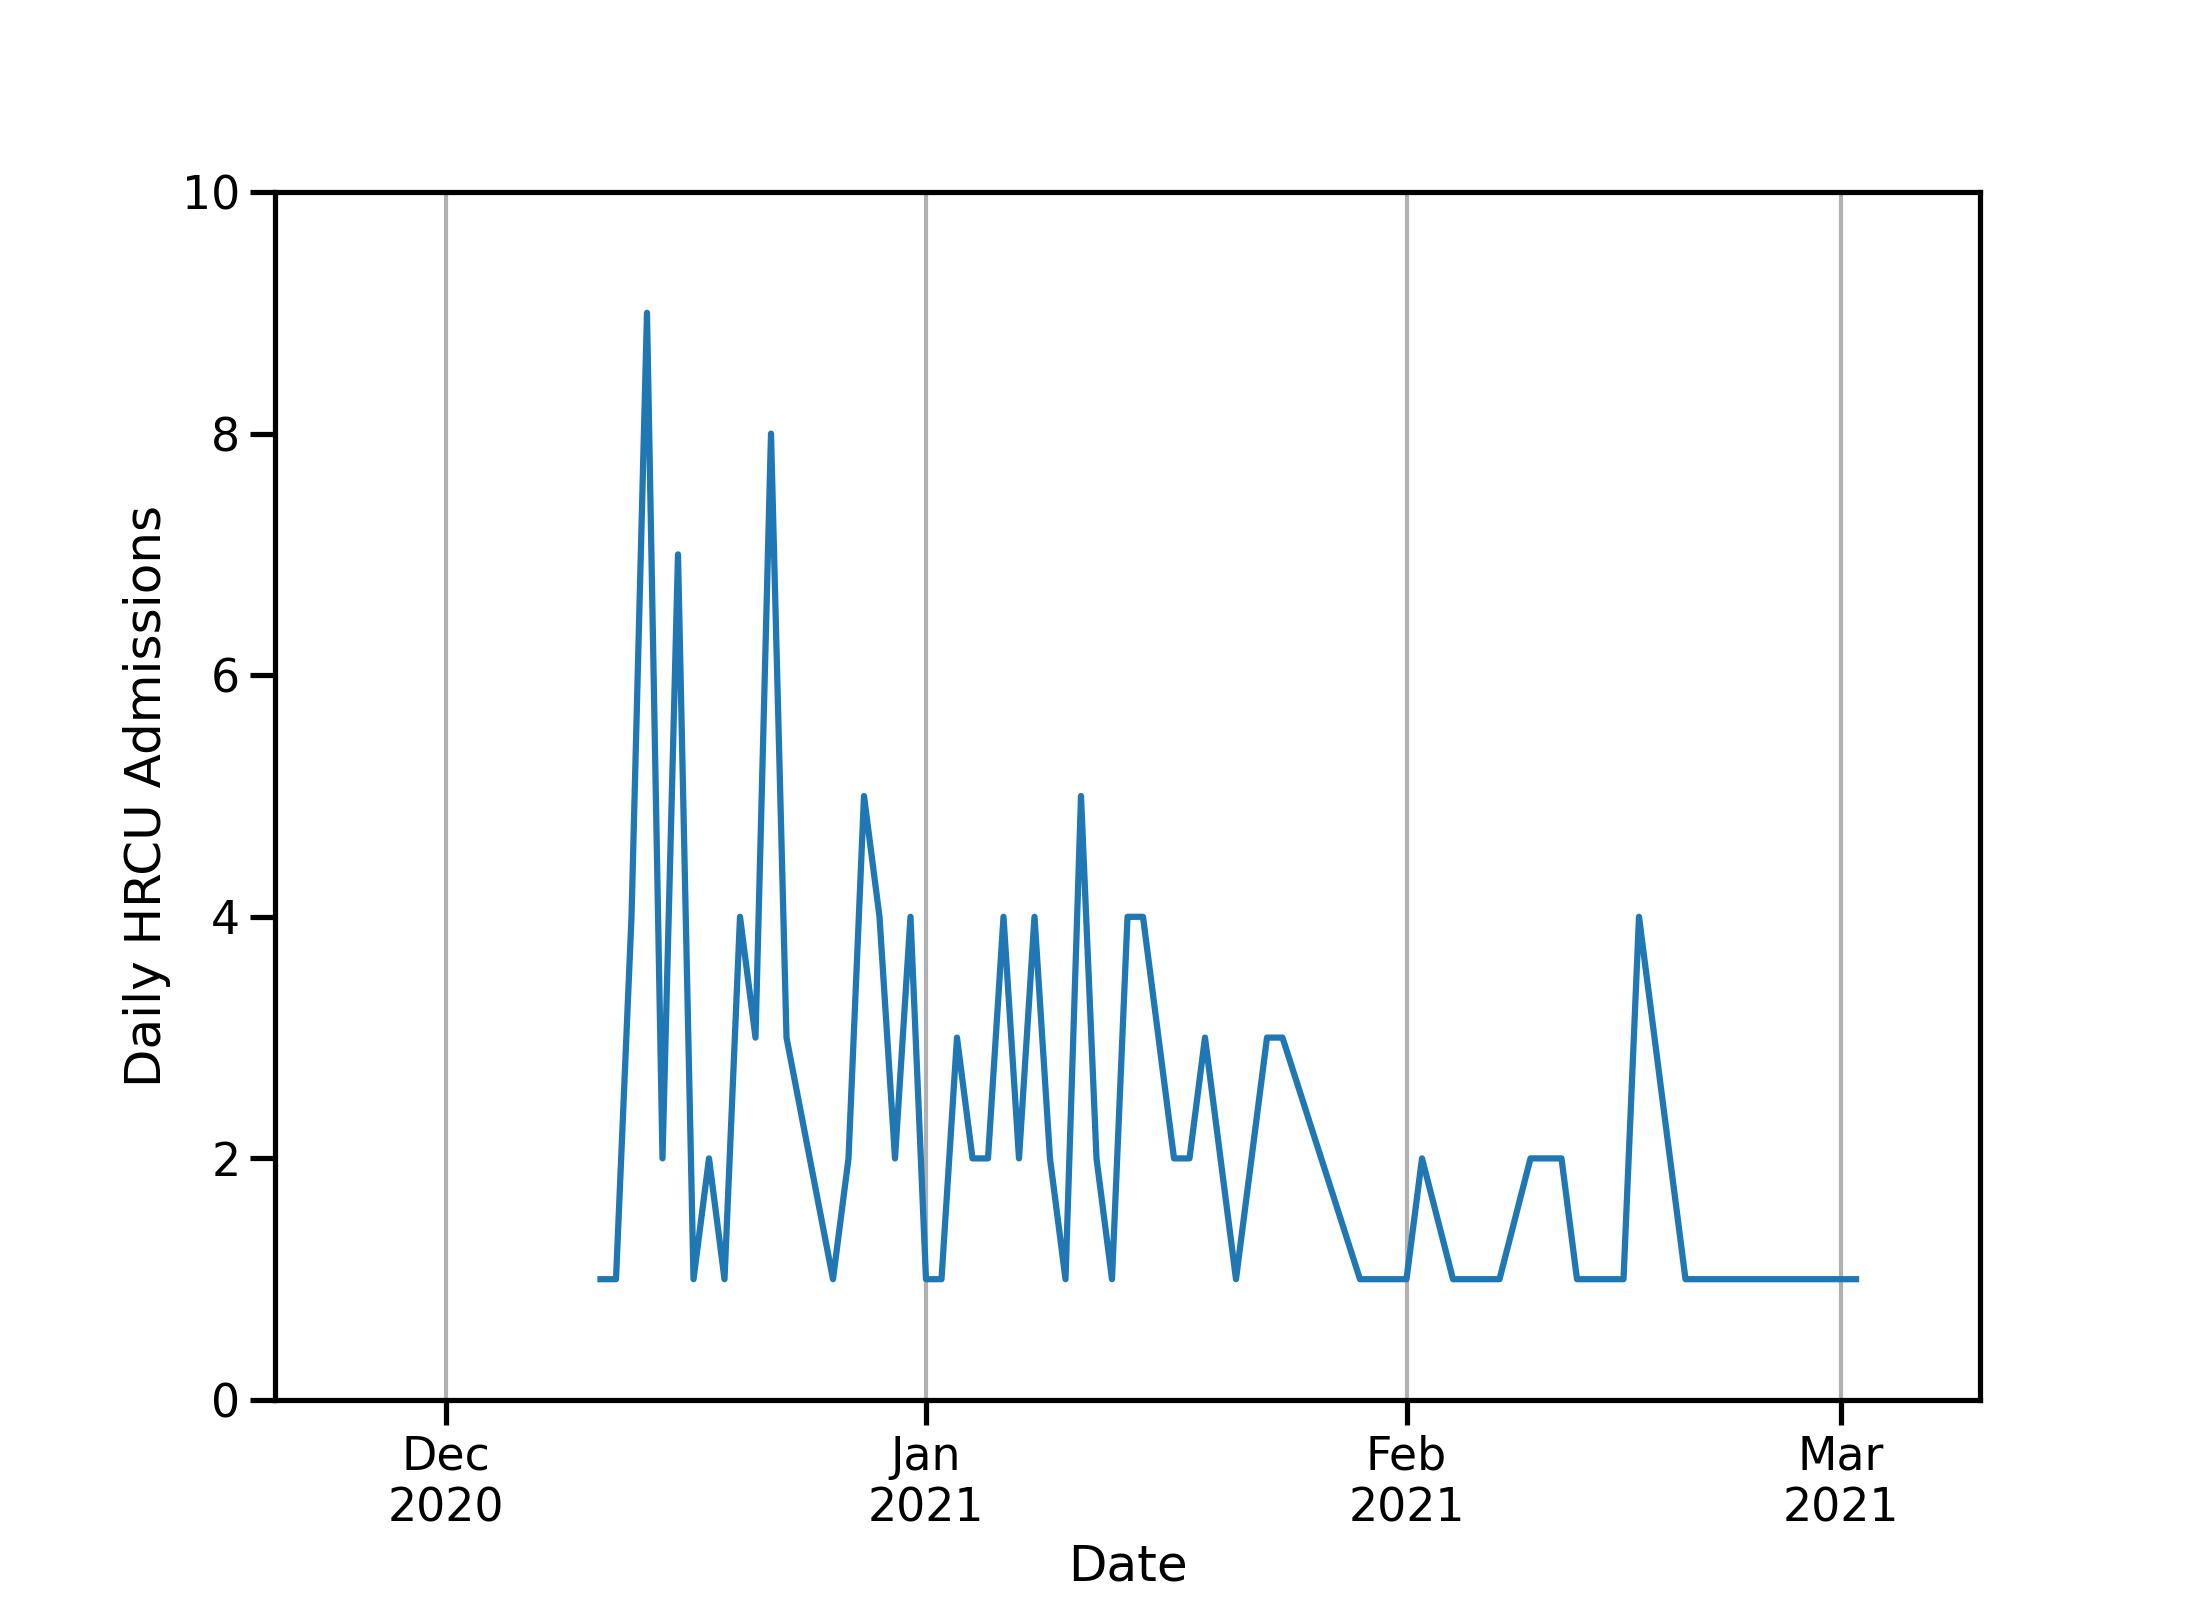
Aside from the fact that a line graph is quite a bad way to visualise this data, we have a few problems. When the ward first opened for business, after kicking all of the non-COVID-19 patients out, it was free and waiting to admit all who needed it, leading to a rush right at the beginning. But without a comparison its difficult to see if this is because of a mass of cases or just taking advantage of the free beds. Further, for various reasons, discharges, and therefore new admissions, occur less frequently over the weekends, so we don’t know if at least some of the rapacious zig-zagging is just the Monday blues.
To remedy this we can turn to the holy grail that is the 7-day rolling average, as well as adding a similar rolling average of the number of new cases in the Cardiff and Vale University Health Board, the total catchment area for our ward.
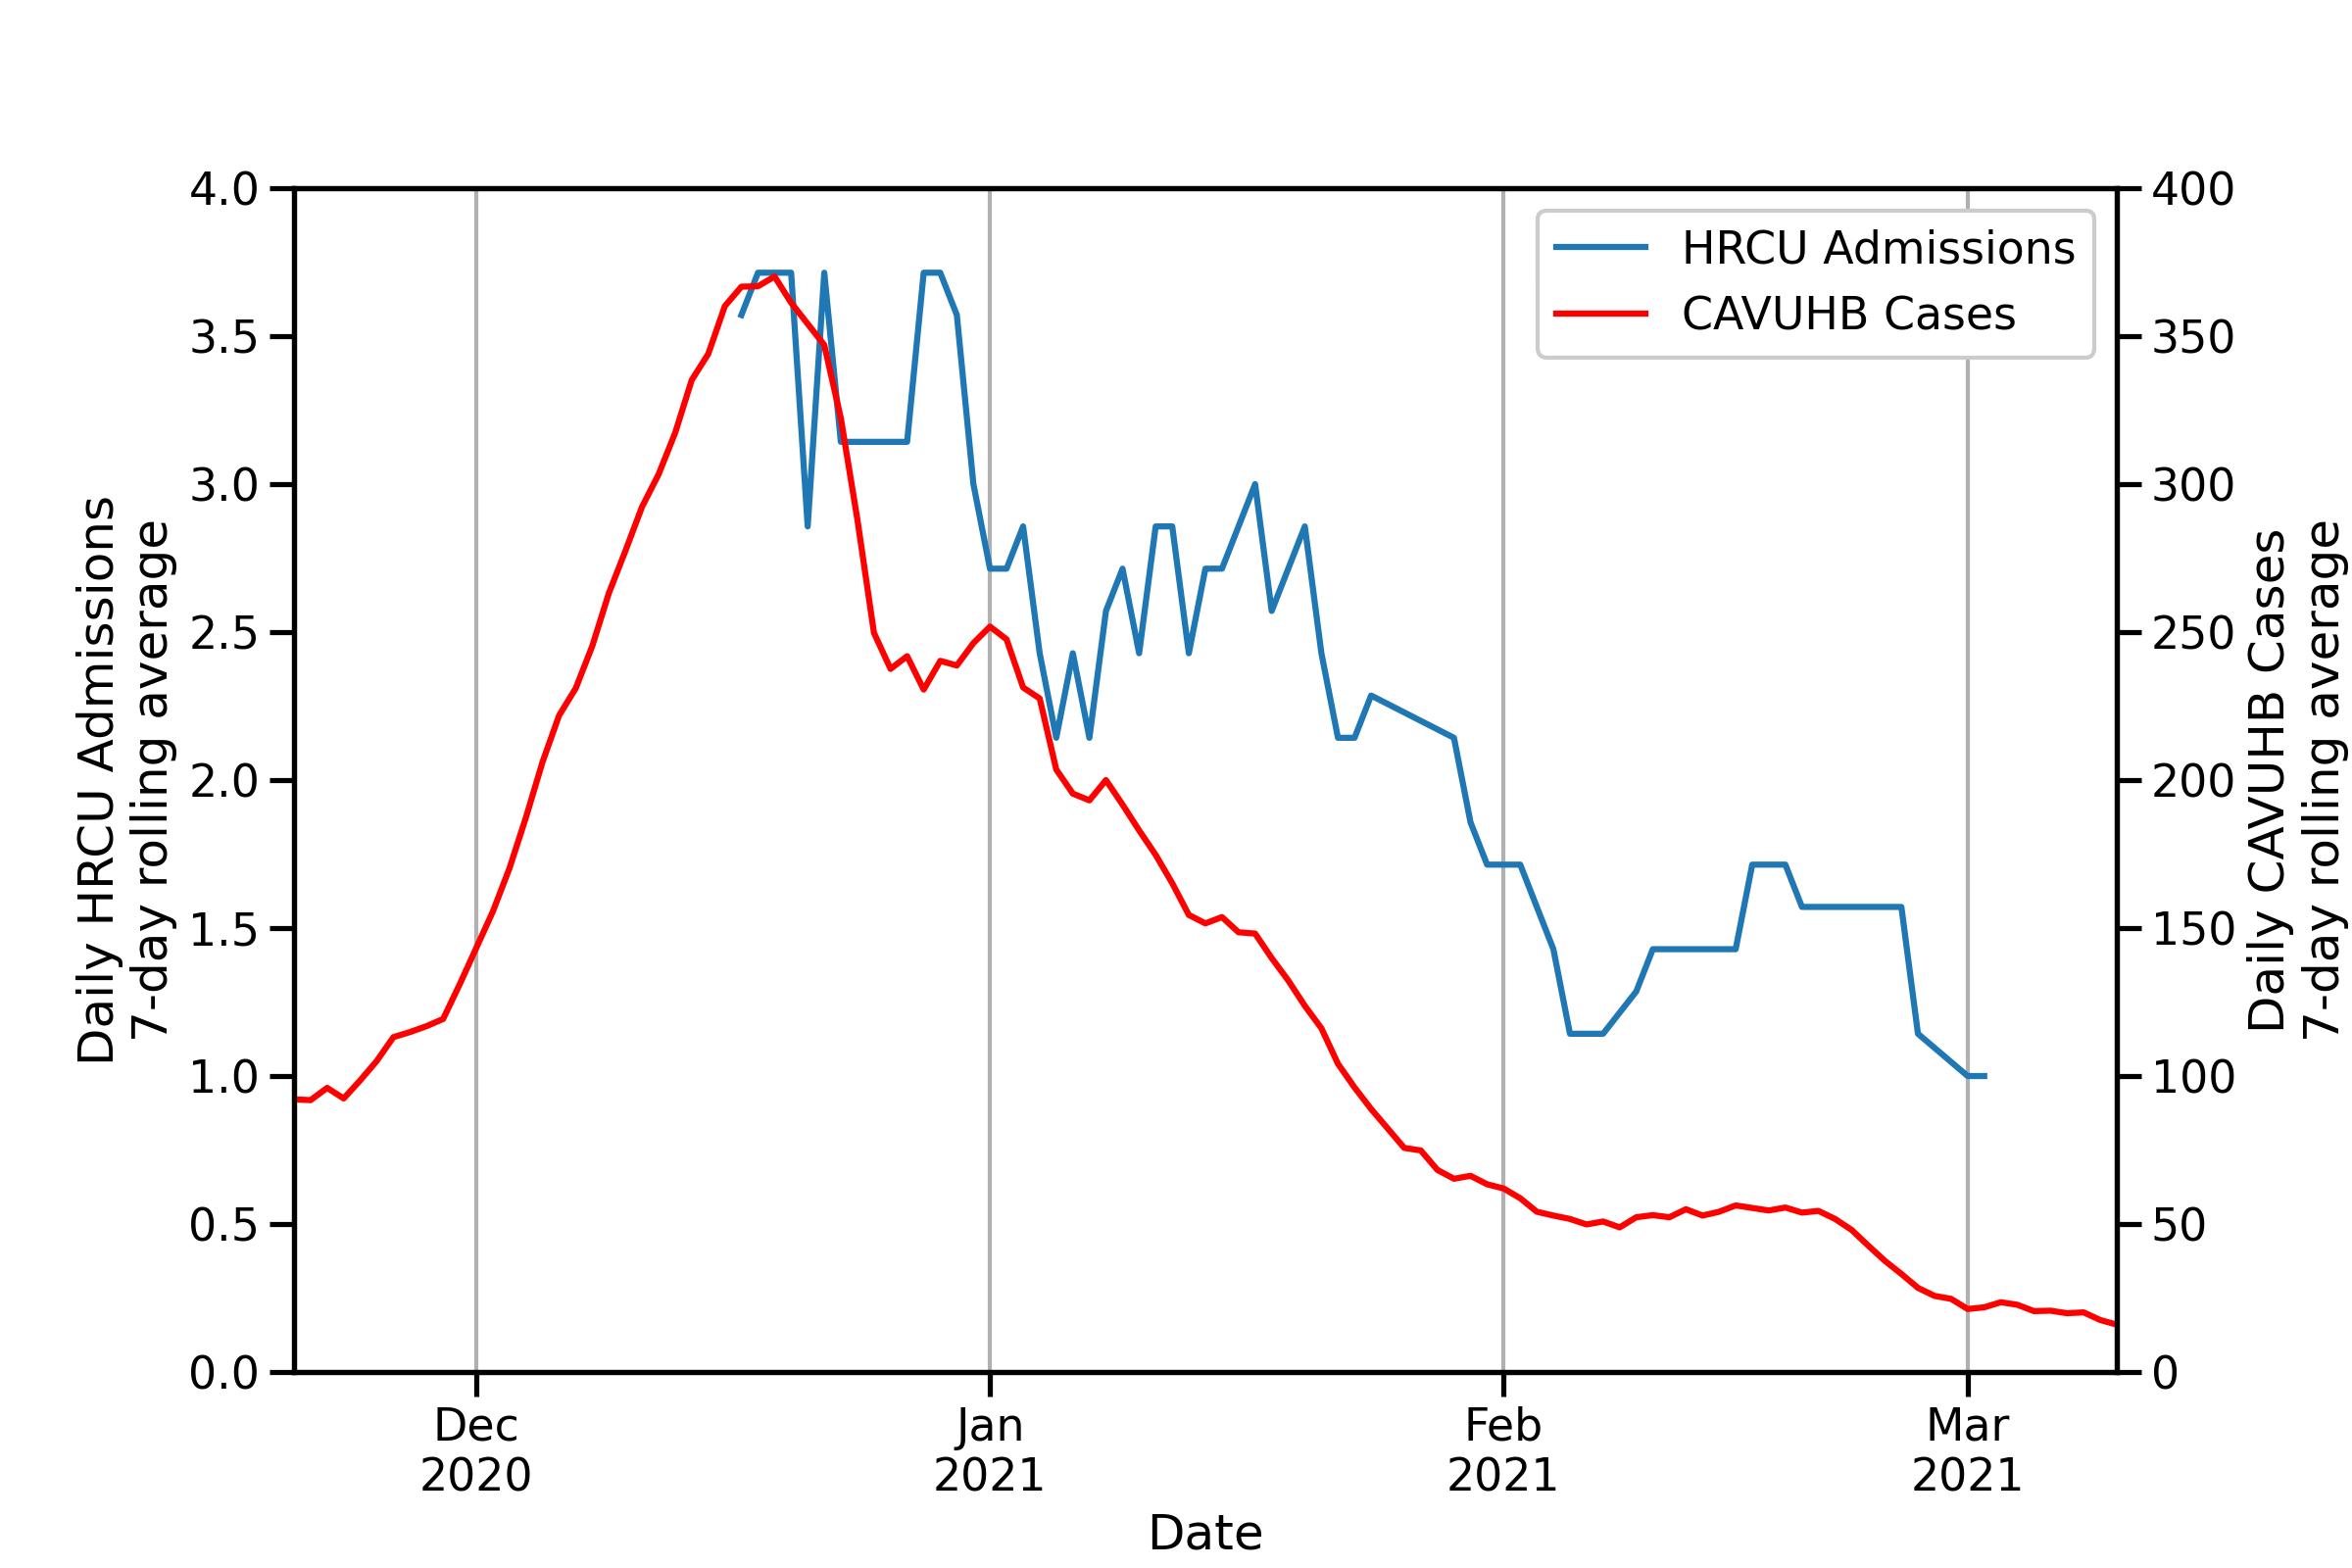
I think we call all agree that this is a much nicer looking plot. As well as smoothing out some of the effects of daily fluctuation, it provides context to our data. On the face of it, they both fall over a similar period, and if we squint a bit its possible to convince oneself of the plateaus in both series of data. However, we often want more surety than what looks reasonable through almost closed eyelids, which brings us to the Pearson Correlation Coefficient, effectively a measure between 0 and 1 of how well points map onto a straight line.
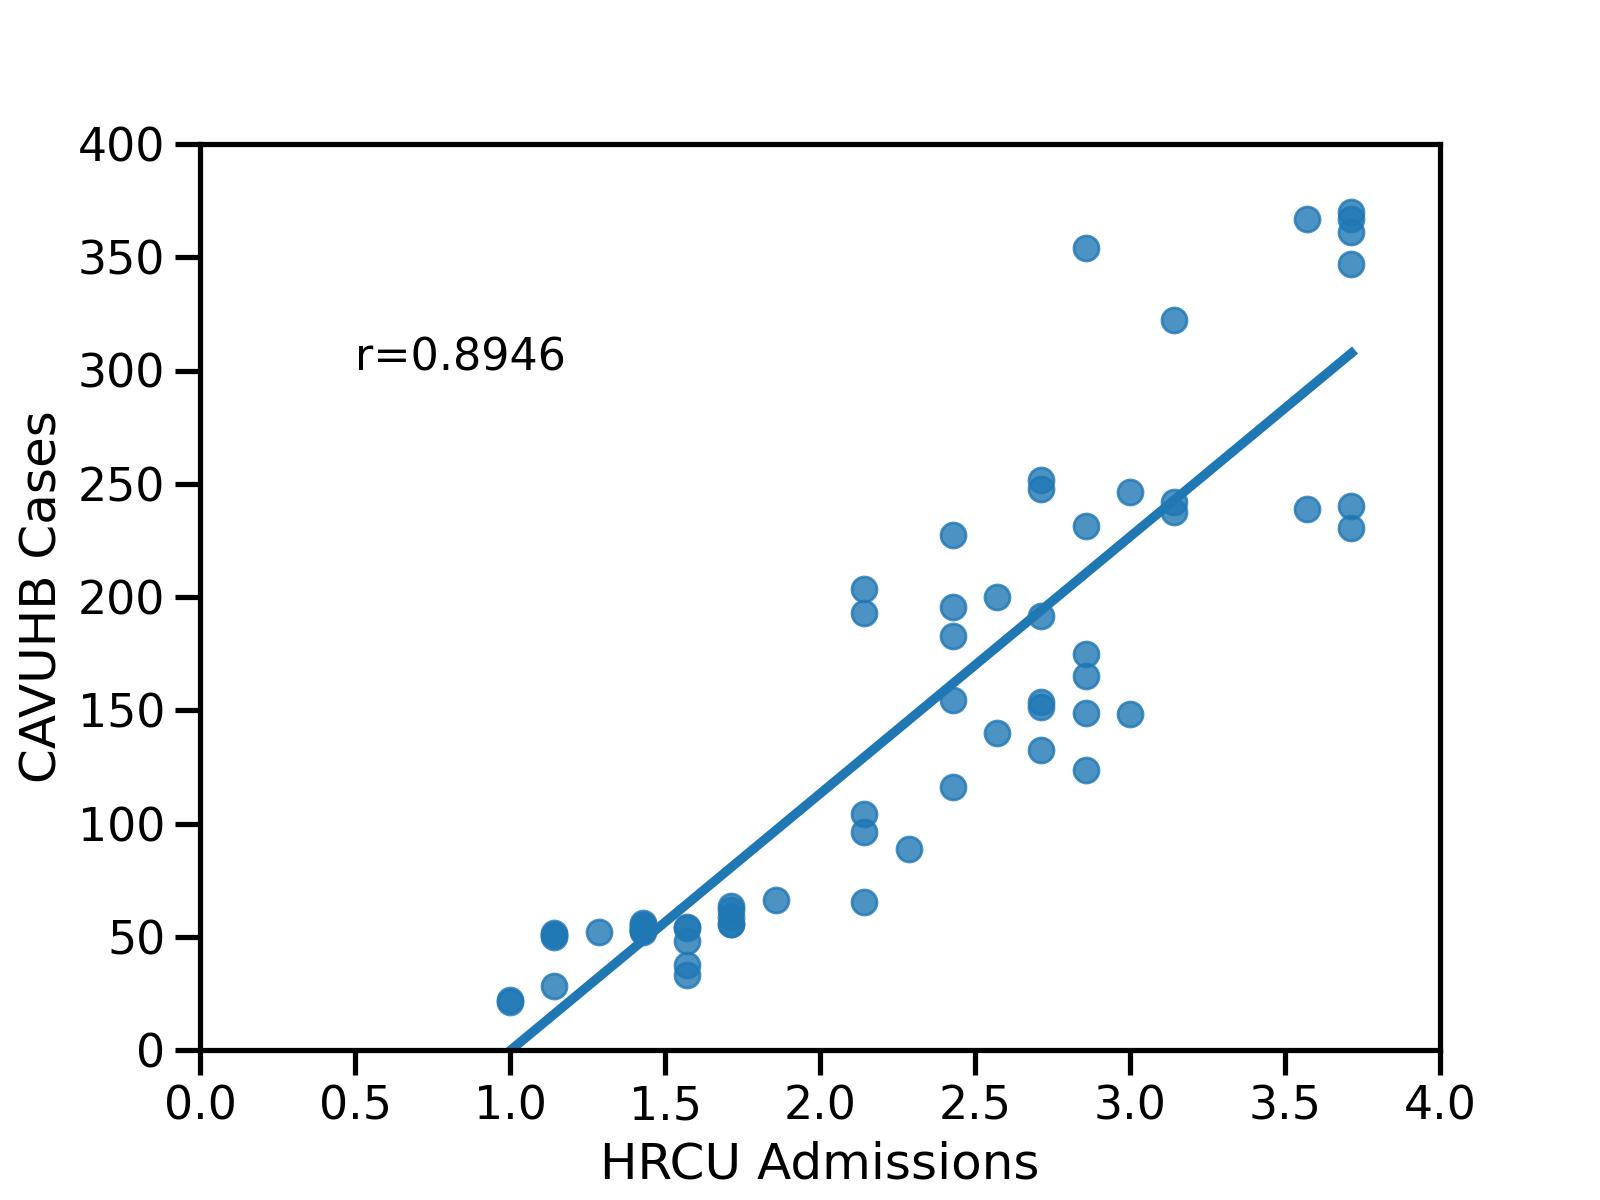
A correlation of 0.8946 is already pretty good for our intents and purposes5, but it doesn’t touch on our initial topic, that admissions are delayed compared to new cases in the community. To demonstrate this, we can turn to the time-lagged cross correlation coefficient. Effectively this just entails shifting the data by an offset in days, then recomputing the pearson correlation coefficient. Therefore, if there is maximal correlation with an offset of 30 days, we’re basically saying that new admissions are maximally associated with new cases a month ago, which would fly in the face of what we known about the progression of COVID-19.
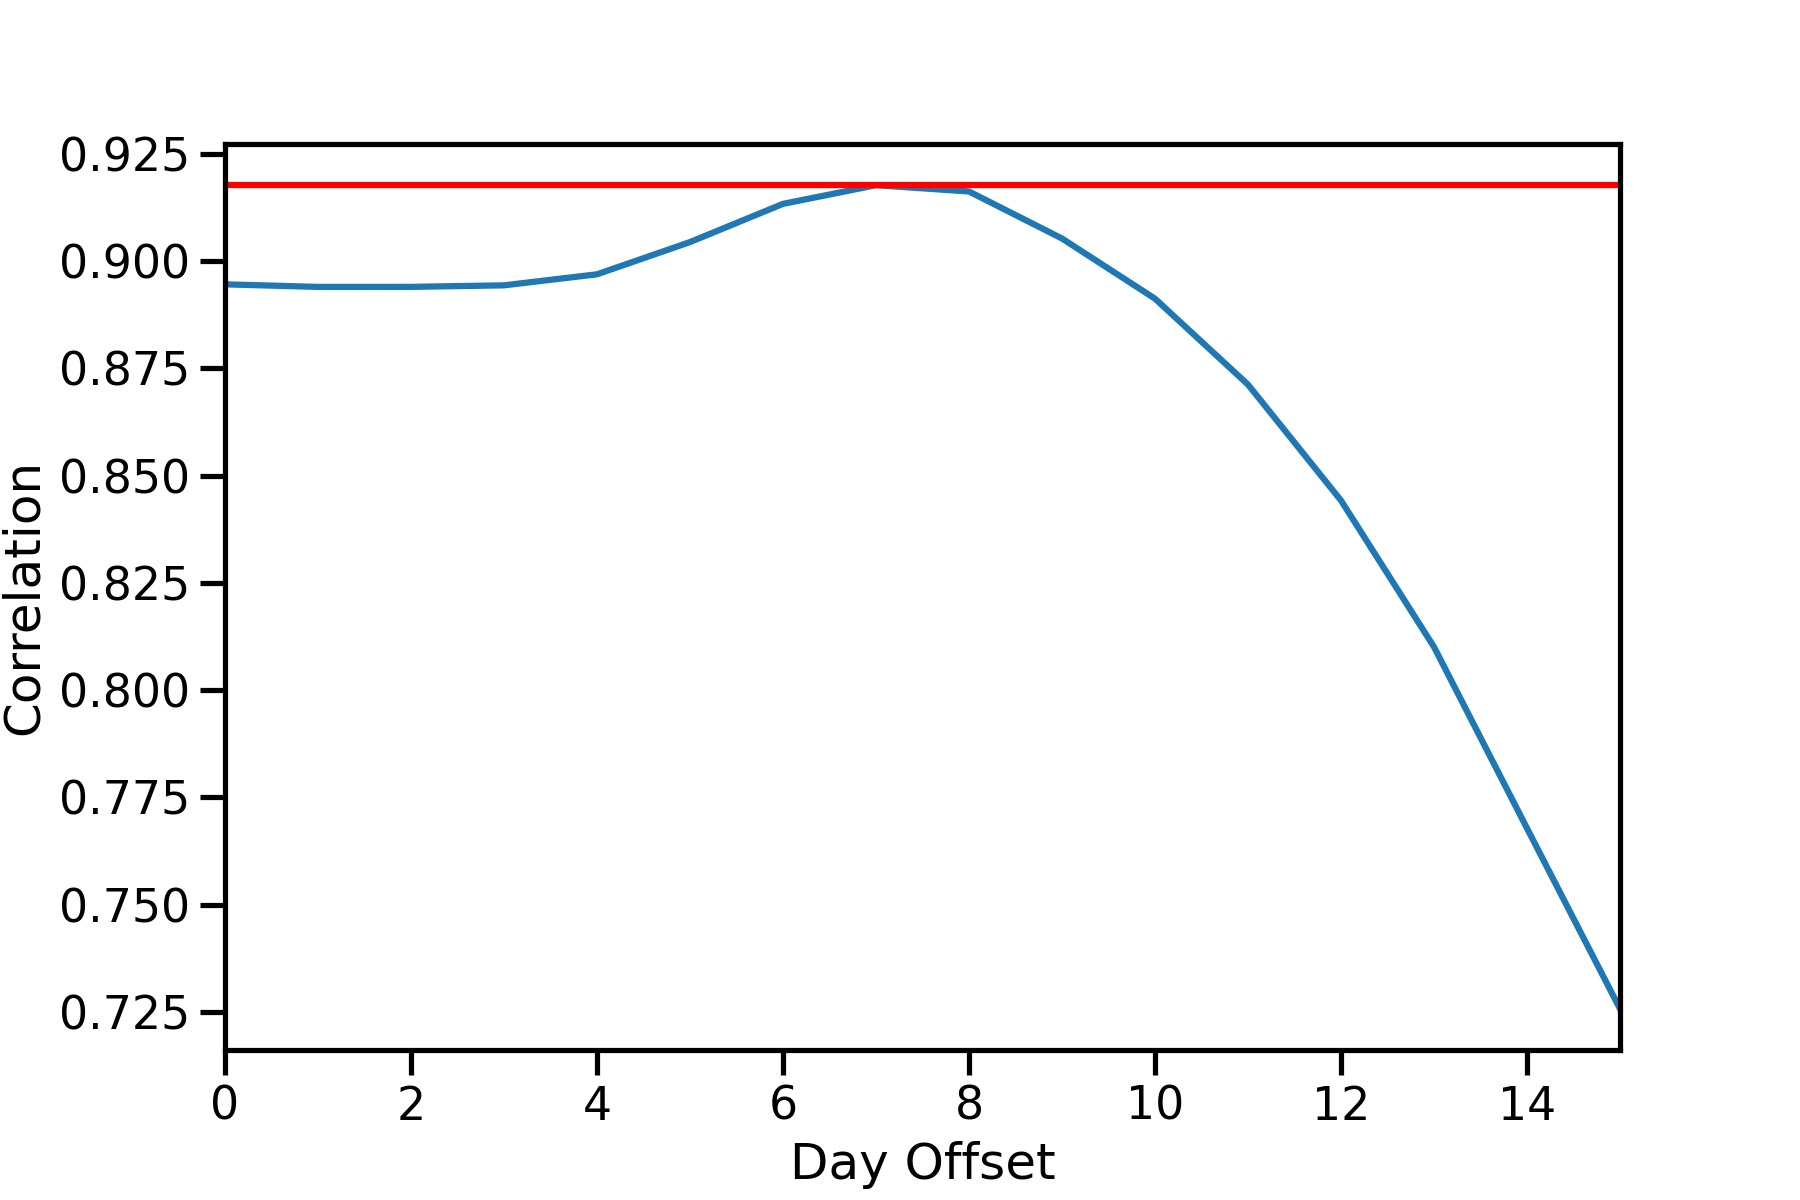
So here we have our somewhat long winded way of showing that during the period December 2020 to April 2021, it took roughly one week for postive cases in the community to make their way into hospital, which is pleasingly similar to the figures described in the existing literature2. I haven’t touched on the statistical significance of these results, as thats a slightly longer subject. Furthermore, the circumstances of COVID-19 today are much different than in the period I collected data in. Reduced availability of testing, different strains with potentially different symptoms, and vaccination all could change the relationship between these variables.
This is based off of work I conducted as part of my MRes dissertation. I’ll aim to accept requests for data and code, though I may need some time to make it legible and to ensure anonymity.
-
Azman AS, Rudolph KE, Cummings DA, Lessler J. The incubation period of cholera: a systematic review. J Infect. 2013;66(5):432-438. doi:10.1016/j.jinf.2012.11.013 ↩
-
Faes C, Abrams S, Van Beckhoven D, et al. Time between Symptom Onset, Hospitalisation and Recovery or Death: Statistical Analysis of Belgian COVID-19 Patients. Int J Environ Res Public Health. 2020;17(20):7560. Published 2020 Oct 17. doi:10.3390/ijerph17207560 ↩ ↩2
-
Booton RD, MacGregor L, Vass L, et al Estimating the COVID-19 epidemic trajectory and hospital capacity requirements in South West England: a mathematical modelling framework. BMJ Open 2021;11:e041536. doi: 10.1136/bmjopen-2020-041536 ↩
-
https://www.ons.gov.uk/peoplepopulationandcommunity/healthandsocialcare/conditionsanddiseases/articles/coronaviruscovid19infectionsurveytechnicalarticle/wavesandlagsofcovid19inenglandjune2021 ↩
-
Schober, Patrick MD, PhD, MMedStat; Boer, Christa PhD, MSc; Schwarte, Lothar A. MD, PhD, MBA Correlation Coefficients: Appropriate Use and Interpretation, Anesthesia & Analgesia: May 2018 - Volume 126 - Issue 5 - p 1763-1768 doi: 10.1213/ANE.0000000000002864 ↩